At my current client, we are gathering the most important data (number of customers) for the company’s well-being and showing it to all the staff, every morning. This is great and has proven very useful to get the attention and interest of everyone. We have spontaneous applause when we are doing great - we have discussions (also spontaneous) on days with bad data.
After the morning meeting with the entire staff (quite literally the Morning Prayer, being a Salvation Army hospital :)), we hold a morning briefing with the extended management of the hospital.
Lately, I’ve started those meetings a bit differently. Quite simply, I just point to the diagram with the data up to yesterday and ask:
Kenapa?
The result was a bit surprising and also rewarding.
Of course (:)) Kenapa means “Why?”. Why did that data happen yesterday? Is there something special that happened?
I noticed that the team was starting to defend bad data by pointing to the better parts instead; “Yeah, Sunday was bad… but look at Saturday!”
That’s understandable but not helpful. And there are a couple of principles around targets and measurements that I took for granted but that were news to my client.
Measure to learn
When we are measuring data like we do, there’s something that needs to be very well-known at the outset; WHY are we measuring this data.
We are not measuring the data to hold people accountable or punish them - we are measuring the data to learn and improve.
I’ve noticed that this has to be communicated over and over. I presume that is because people are used to the opposite; being held accountable for, especially bad performances.
If you can turn this view into instead viewing it as something to learn from there not only a much nicer atmosphere but it’s more fruitful as well. It’s not you reporting to me but us, together trying to improve bad and celebrating good.
There’s only data
There’s no good or bad news - there’s only news
I don’t know how many times I have restated this, both in Indonesia and in Sweden. This little phrase is one way to remember that we are measuring to learn.
To me, it’s also being honest with yourself and starting where you are (like kanban teaches us. There’s no use lying to ourselves and painting a prettier picture than the truth.
This is where we are now - how can we improve? This is the data - what can we learn?
Also, related to this, we need to make sure that everyone understands what we are measuring and what that means. If not, you will note that the data is uninteresting and ignored by many. That’s not really useful if you want to learn.
Two data points are not a trend
I’m the biggest sinner here, let that be made clear. I’m so eager to start analyzing and trying to improve. With one bad day of data, I want to change things around.
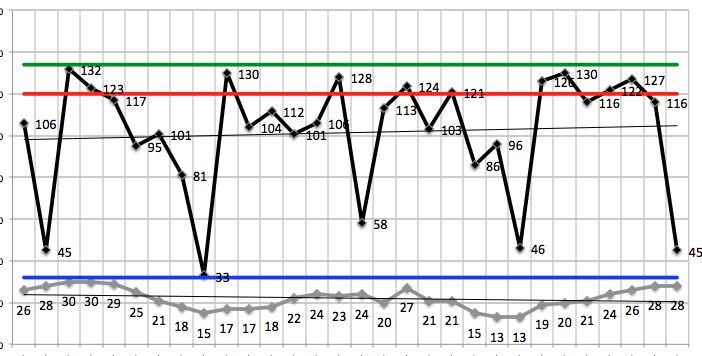
It’s better to play it cool and wait until you have more data. In our case, we saw that certain days (Sundays) always were hovering about 1/3 of the patient count compared to the other days. The first Sunday we were really scared. But then the second was the same. And the third. This was a recurring phenomenon and the trend was clear - but it took us 3 Sundays to start seeing that trend.
Now, why is that? And what can we do about it? We did some things about it but we didn’t react to the first occurrence.
Always ask “Kenapa?”
One of the most profound experiences for my client, and that made them realize that me and my team was serious about “measuring to learn”, was when we had an awesome day.
I again started the morning briefing with: “Kenapa” and the looks were just puzzling. I had asked them a couple of times already, on bad days, Why we did as we did. And we have had some fruitful discussions about that and even implemented a couple of countermeasures (as I mentioned above). But now?! We were doing good! Why are you asking us Why?
Well - the data tells us that we are doing something good. Let’s stop and think for a while what that is. So that we can do more of it and maybe even improve on it. Maybe there’s something that we have stopped doing during these days - let’s make sure that we don’t start doing them again.
Summary
If you go through the trouble of gathering data and if you are serious about using it to improve:
-
Measure to learn and not to punish
-
There is no good or bad data - there’s just data. Make sure everyone feels safe to report the real data, by emphasizing this.
-
Don’t act until you have enough data to see the trend
-
Ask WHY - even on the good days