Many teams I visit nowadays have ditched story points and start to use Small, Medium, and Large (aka T-shirt sizes) estimation instead. I like that. But very often a smell is creeping into the estimation, removing the “relative” out of “relative estimation”. Here’s how this problem will reveal itself. When someone suggests that you’ll use S, M, and L for your estimates you will soon hear:
Ok - so a S is 1-2 days, M 3-5 and L 5-10 then or what’s the scale?
Don’t do that - it’s the wrong way around. In this post I’ll explain why and what is a better, more trustworthy, candid, and transparent approach.
Why attaching day-span to the estimate is bad
Well, it’s quite obvious isn’t it; doing that (S = 1-2 days) is just giving “1-2” days another name. From that follows “resource-days”, then Gantt Schemes and the suffering that we all know of. S, M, L is intended to communicate the uncertainty and that we uncover things as we go, while still giving some kind of size to the items. Funnily enough so ware story points, but it’s easier to misuse since they are numbers. S, M, L are in themselves uncertain since we all know that two t-shirts that are S are just roughly the same size. Attaching day-spans to them before you estimate is destroying this.
What should we do then, Mr Smartypants?
Quite simply: don’t estimate the size - base it off data instead. It requires a few very simple steps.
Classification into S, M, and L
One of the simplest exercises I know about estimating in S, M, and L is an exercise we in Kanban in Action called “a line of cards”. It’s quick, simple, and good enough. Here’s what you do:
- Pick an item from your backlog and write it on a sticky and place it in the middle of a table
- Pick another and ask the team: “Is this bigger or smaller?”
- if bigger put it above
- if smaller put below
- Take another item and ask the same question, placing it in the correct spot in the line; below things that it’s smaller than - above stuff it’s bigger than
- Continue until you run out of cards or when it feels suitable (for example next release or sprint)
Now you have a long line of cards ordered by their relative size. The biggest is on top, the smallest at the bottom. Now go through the line and call the bottom third Small, the middle part Medium, and the top third Large.
Track lead time
The second part is super simple, when you start to work with the item (when you put it on your board, for example) write the current date on the sticky. Once it’s deployed (or you take it off the board), note that date and start to track it in an Excel file or something.
Pretty soon you will have some data like this:
| Size | Start date | End date | Lead time |
|---|---|---|---|
| S | 2016-01-04 | 2016-01-05 | 1 |
| M | 2016-01-08 | 2016-01-10 | 2 |
| S | 2016-01-05 | 2016-01-08 | 3 |
| S | 2016-01-02 | 2016-01-04 | 2 |
| M | 2016-01-05 | 2016-01-09 | 4 |
| L | 2016-01-01 | 2016-02-01 | 31 |
Data-based prognosis
This means that now you make something much better than an estimate. Because now you can say this:
From what we’ve learned so far our S takes 1-3 days, M 2-4 days and L 31 days. We know this because we have done 3 Small, 2 Medium, and 1 Large so far
It’s now easy to make a prognosis, based on the data. Let’s say that you have 20 S, 20 M, and 10 L in your backlog: (20 S x 1-3 days) + (20 Medium x 2-4 days) + (10 Large x 31 days) = 91 - 231 days
This is much more trustworthy and candid than to give an estimate. Of course, this will raise some questions:
- How certain are you on that?
- Will all L take 31 days?!
- But that’s only 6 stories… it’s not very certain now is it.
Don’t be alarmed. This conversation, with your stakeholders, is the whole point. Because now you can start a candid (yes, I’ve learned a new word) about your prognosis. Of course, 6 data points are very little, and only one L is almost stupid to talk about. With only one data point, we can’t really say anything. That one might have been exceptionally big. Or small. We simply have to wait until we get more data before we will know. The S could also be off. It’s just 3. And the M. Basically; with this few data points, the uncertainty is great. Stating anything else, at this point, is a lie.
But this is what you know now. Most of the time we are asked to do estimate before we know anything about how much we produce. Also, after a few weeks more you will have more data. And the prognosis will be better the further you go.
Stats, stats and some more impressive stats
You can even go statistical on their … mind and display a control chart, like the one Håkan describes in his excellent post. I have borrowed a picture from his blog:
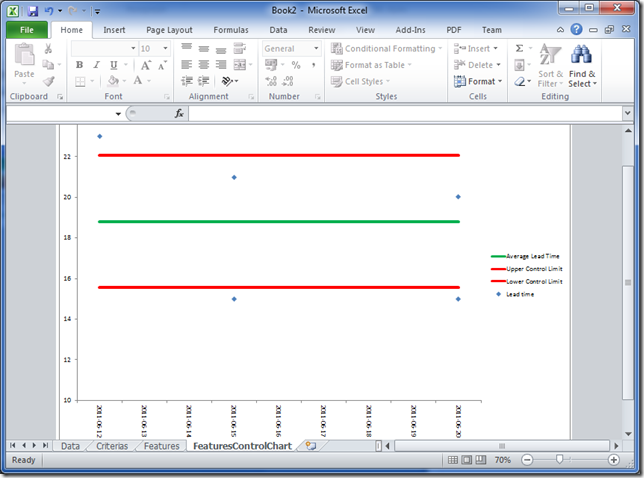 Now it will be easier to give better and better predictions: using the upper and lower control limits you can use statistical theory to say something about the certainty about your predictions. Using the setup Håkan describes (using 1 standard deviation above and below the average) you will have, according to stats, 70% certainty in your prognosis. Adding a wider span (2 standard deviations) for your control limits, will make your prognosis certain with 95%.
XS? Or XXS maybe - or something else?
Inevitably, people will suggest that you introduce and XL or XXS to your scale. At this point I always suggest that we only use one size instead: Story. Because that is basically the same thing; tracking the data in the same manner we will sooner or later be able to make pretty certain predictions within what span our next story (of average size) will fall.
Goldilocks estimation
There’s an exercise that I like a lot where you turn the estimation on its head: it’s called Goldilocks estimation. And it’s not really estimation at all… Basically, you just pick one of the stories you’ve done that felt about the right size. Then for each item in your backlog (or how far you need to go) you simply ask: is this just right or too big, or too small. For all the things that are too big we split them into just right sized items. For all the items that are too small we merge them into just right. This will help our prognosis to be more accurate with a narrower span.
Summary
S, M, L is another way to do relative estimation. Let that be relative and don’t lock down the sizes on beforehand - that’s just giving other names to “man-days”. Instead let the sizes be relative and deduce the days from data. In this way, you can be transparent with your data and make accurate prognosis on your progress.