Just a short post about data and a common objection. At my current client, we have a lot of data about the customers (patients at a hospital) that we serve each day. We have measured the same way for about 4 months now so it’s pretty accurate.
Lately, I started to see a trend about how the patients are spread. Here’s a typical month. See how the Sundays are really bad (yeah, that’s the super low points). But there’s another trend here. The weeks keep falling - I thought at least. The Mondays are always best and the number of served patients gets lower and lower.
What can we learn from that?
Verification
First, I verified my hypothesis by proper analysis. I created an Excel formula that went through all our data and calculated the average per weekday.
There’s an Excel formula called Weekday that returns a number (1 for Sunday to 7 for Saturday). So creating an average for that is easy:
{=AVERAGE(IF(WEEKDAY($A$2:$A$132)=2,$B$2:$B$132))}
- The dates are found in the A-column
- The values in the B-column
- 1 in this case means Mondays
Note that to get this to work it has to be an Array formula. This is accomplished by entering the formula with CTRL-SHIFT-Enter (PC) or Command-Enter on a Mac. Once entered correctly it will have curly braces around it.
I added the Min and Max formulas in similar fashion.
Analysis
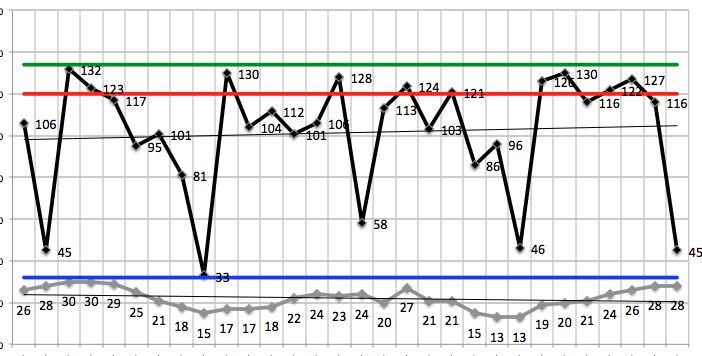
From this, it was easy to create a nice chart. And sure enough: the values are falling. I have removed the actual values from this graph to not reveal too much about our status. We can see two main things here: Yeah, Sundays are really bad - we knew that already. And we have acted on it by extending opening hours etc. But it seems like people are not going to the hospital as much on Sundays, because our efforts have given us a very small increase.
Secondly, the trend shows clearly that it starts high on Mondays and is sloping downwards in a steady decrease until Saturday (and then the special case Sundays). The difference between Mondays and Saturdays is approximately 20%.
Objection
“But we can’t do anything about that!?”
is the common and reasonable objection to some trends, like these.
First of all: “Do we have to?”
What would be better by smoothing this out? Should we try to raise the later days in the week or lower the ones in the beginning? Are we struggling on Mondays and have nothing to do on Sundays? There are a lot of questions that can be asked around if we actually should do something.
Secondly: “Are you sure?”
Now that we see this and accept that this is a clear trend - how will we change our behavior to handle that situation? Can we ask people to come later in the week? Can we try to change how we’re booking? Maybe there’s a cultural/common way to do things that we can address with marketing - do people know that we are open on Sundays?
Finally: “Maybe you are right - we can’t do anything about that. - Now what will you do?”.
This is knowledge that we have harvested from this data; let’s use it. If this is a constant or at least something that we cannot affect - how can we use that? Maybe we could staff differently? Maybe we can open new services on the later days in the week? Knowing this we could do training and other things that take people away from work on the later days in the week, since Mondays are busiest. If we have renovation work to be done - later in the week is better than earlier.
And so on…
Approach
There are lots of things that we measure that we (possibly) cannot affect. But that doesn’t mean that we cannot learn from it and adjust to take advantage of the knowledge.
Measure to learn is an approach that I’ve found very valuable. All information we can harvest can be used to learn and improve.