Scope creep is a common phenomenon in software development where the size and workload increases beyond what we first envisioned. In many cases this is so small that it happens without anyone really noticing but sometimes it can degenerate and slow down progress considerably. Sometimes even stopping a progress or team completely.
Scope creep comes from many sources, sometimes from the outside, but I think that the most common one are ourselves:
That value should probably be a configuration property…
What if someone decides to change database server…
This is of course good questions to ask and could be value, but I think there’s more value in getting a feature in front of users and learn about their behavior and how the feature is doing. After that we can harden it, make it more flexible or otherwise improve it.
Drifting away from my main topic… So now you’ve experienced scope creep too and how easy it is to fall into. See what I did there ^^
On a more serious note - this post is really about how I’ve seen scope creep being visualized and managed by a few teams on their board.
One of my teams started a nice little practice that I’ve seen a few places: each day they dotted each card in progress on their board with a dot. After a few days it looked like this:
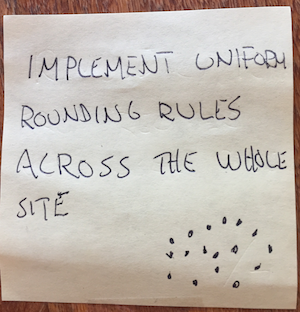
When I asked them what it was for they said that they wanted to track how many days the sticky had been worked on. That was great! What an easy to see, do and follow visualization. But then I asked them what behavior / decisions they we’re going to changed based on this information and that was not really decided yet.
Quick side note: that is a nice little question that I’ve picked up from the awesome How to measure anything book. This measurement - or practice for that matter - how will we the information it gives us change our behavior. Very powerful question to understand the real need for the things we are doing.
No problems with that - what to do can grow on you. But it started me to think about how this can help us to track scope creep on our board. Because that is really hard to see and understand that it’s happening. And it might also be something that we actually want to have sometimes, when we are in discovery mode for example.
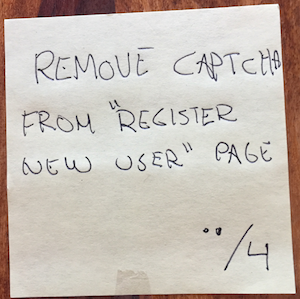
I suggested for the team that they decide on a limit of days that they think that the stickies will be on the board. For example; “We want all our stickies to take a maximum of 5 days” or you can write down a blink estimation on the sticky like this
Once we reach this point we have a decision to make; now this is work is taking longer than we initially thought it would:
- Should we press on, because we are “soon” done?
- Should we add more people on the item to make sure we understand it better and can finish it
- Should we split it up somehow; stop doing the gnarly configuration values and just hard code it - leaving the rest to another time, or fake the integration with that third-party vendor that takes forever. Splitting tasks like that is a good idea - I know; I’ve asked an expert
- By the way - what has made this item creep in the first place. Is that something that we can ensure doesn’t happen again. Maybe it’s time to 5-why this sucker to really understand what is happening?
The team I talked to had a default approach of adding more people to the tasks for at least a day to see if we could finish the item. After that they talked about finding ways of breaking the item down
Is there a counter for each column, then?
When suggesting this approach to the team someone asked me if there’s a counter of how many days have this item been in this particular column. Questions like that is dangerous to ask a coach because he will try to look like Yoda and say:
Find it useful you do? Hmm? Then do it you should
But in my mind I think that items that take several days in each column is probably too big to start with - maybe breaking it down into pieces that can flow over the entire board in a shorter time period would be better.
Summary
As you can see from the questions above what happens is that we run a little mini-retrospective around this one story that now doesn’t behave as we thought that it would. It can be kept super short - probably as 2-3 questions during the morning meeting, or just a quick decision.
The important point, as with almost anything that we visualize, is that we now get a visual signal about something not behaving as expected. That means that we can make thought-through decisions on how to act on it. We can sure press on and finish the item - but at least we know why we are doing it.