Yes, yes … I know. I do way too much Google Sheets for my good. But that tool is SO amazing. It’s becoming my first go-to-tool when it comes to small simple tasks at the office. And it allows us to be more data-driven and visual.
And it’s very easy to build aggregation tools for people around the office. For example; the other day we were wondering what kind of technologies that was hot in different cities in Sweden.
From that question, until I’ve created a simple but powerful tool to scrape data from Indeed.com, presented it with a simple filtering function and got it in the hands of the sales team was 45 minutes.
In the process, I learned about two new friends; IMPORTXML and the slicer-feature of Google Sheet.
Let me show you what we did.
Where’s the information?
I headed out to the Indeed website and searched for React and Node jobs in Stockholm. And unsurprisingly a list of ads was displayed. Many jobs. Like 170+. I got a paginated result back with 5+ more pages. But on top was the information I was looking for:
Sida 1 av 183 resultat
A bit strange formatted but it says: page 1 of 183 results. Ok - there are 183 ads for with React as a keyword.
Then I looked at the URL to the page that looked like this:
https://se.indeed.com/jobb?q=react+node&l=stockholm
From this, it was simple to figure out that q= was the search params and the l= contained the location. I tried
https://se.indeed.com/jobb?q=react+angular&l=stockholm
https://se.indeed.com/jobb?q=react+node&l=göteborg
And those links worked well too.
Creating the URL
I now created a Google Sheet with Keywords in column A and Location Column B.
| Keywords | City |
|---|---|
| angular | stockholm |
| vue | stockholm |
| node php | stockholm |
| react | stockholm |
Then it was pretty easy to concatenate the parameters into the URLs above, using the HYPERLINK-function, which I placed in the C-column:
=HYPERLINK("https://se.indeed.com/jobb?q=" & ENCODEURL(A2) & "&l=" & B2)
The only thing to note here is that I needed to ENCODEURL which allows me to accept the Keywords with spaces.
Get the data
Coolio - now we have links to click. But let’s use another Google Sheet function called IMPORTXML, to get the data from the page the URL points to.
I went back to the Indeed search result, now by clicking one of my generated links, and then right-clicked the “Sida 1 av 197 resultat” text, and selected Inspect. This took me to the Google Chrome developers tools, at the location of the <div> in the HTML document.
In there I can just right click the <div> again and select Copy -> Copy XPath. In this case I got:
//*[@id="searchCountPages"]
On my clipboard. Perfect. This kids is an ancient way to do query selectors in any kind of XML document. It means that we can now get hold of the contents of that cell.
Back to my Google Scraping automation sheet I created a new column, D and enter the following formula:
=IMPORTXML(C2, "//*[@id='searchCountPages']")
- C2 - holds the URL for my search of, for example, angular and node ([https://se.indeed.com/jobb?q=angular%20node&l=stockholm](https://se.indeed.com/jobb?q=angular node&l=stockholm))
- The second parameter is the XPath expression we let Google Chrome generate for us
There’s a little bit of string parsing to be done, to get the number from the string Sida 1 av 357 resultat
=INDEX(SPLIT(D2, " "), 1, 4)
Here’s the entire table
| Key words | City | URL | Result | Hits |
|---|---|---|---|---|
| angular | stockholm | https://se.indeed.com/jobb?q=angular&l=stockholm | Sida 1 av 357 resultat | 357 |
| vue | stockholm | https://se.indeed.com/jobb?q=vue&l=stockholm | Sida 1 av 123 resultat | 123 |
| serverless | stockholm | https://se.indeed.com/jobb?q=serverless&l=stockholm | Sida 1 av 66 resultat | 66 |
Amazing things happen
But now something amazing starts to happen as I change value is Key words and City-columns. The Result-column quickly blinks with “Loading” and then presents the result.
What if I created 10 or 15 jobs in Stockholm and then copied it down to get Göteborg and Malmö. Sure enough … it works beautifully.
It’s pretty cool to play around with.
Visualize, slice and dice
But not super easy to interpret - let’s make a visualization.
I create a Bar chart with all the data in A, B, and D (results) and put it on a separate sheet.

But then I remember reading about something called a Slicer. Sure enough, in the Data -> Slicer menu it can be found. The Slicer allows you to do personalized filters of data in charts.
When you create a data slicer it asks you to select a data-range, and I selected all of my data on the sheet where the scraping is being done. The next thing you need to do is to select a column to slice the data on.
Once you are done it looks something like this:

It works exactly like a filter and filters the data, but with one important difference; it’s only for your individual view, and doesn’t affect other users.
Also, charts that are using the data range the slicer is operating on is updated. For example; select keywords “node” and “node php” and the city of “
Stockholm” will give you the following chart:
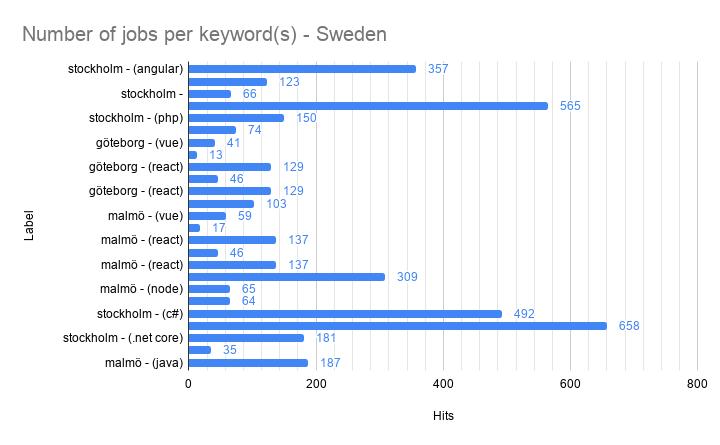
Conclusion
This was a really fun and pretty useful little hack that helped us to become more data-driven in our discussions: I think there are more Angular jobs in Stockholm than there are React jobs in Stockholm can now be answered easily, visualized and updated live.
Psst - no. There are many more React jobs in Stockholm right now.