Ever since I first read When will it be done by Daniel Vacanti I have been fascinated with how much prognosis work that can be created using very little data. I have written extensively about these “kanban metrics” in other blog posts, should you want a deeper understanding.
Dan and the Actionable Agile Team have created a brilliant tool called Actionable Agile which has many more capabilities than I will show here. This is a straw-man version, BUT I learned a lot of the mechanics behind the scenes in creating this and I hope you will too.
I love Google Sheets, so I’m going to work there, but you can probably do this in Excel with minimal changes. You can follow along in this sheet that you can make a copy of to tweak.
When will it be done?
The book does an amazing job of describing much of the background to why and how to do data-driven prognosis than I can even summarize here, so I’m just going to cut to the chase. The two main questions I wanted to be able to answer are:
- How long will it take to complete the next item?
- How long will it take to complete X number of items?
Turns out that these questions can be answered with some statistical analysis based on some very basic data. We only need two data points per work item; when did we start the work (“Could you please?”) and when was the work completed (“Thank you”). If you are using JIRA these items can easily be found as Created and Resolved dates.
Since we are going to produce a prognosis we want the answer to contain a span and a confidence percentage. “It will take less than 25 days with 80% confidence”, for example.
Let’s do the simple things first
Gather data
I’ve always found it useful to keep the raw data around and then base all subsequent calculations on that data, rather than copy data between tabs. So let’s first create some raw data.
Open a Google Sheet and create a tab called Raw data. Then make some data up (you can use mine if you want). If you are using a tool like JIRA you can export a CSV file and import it here.
Here’s some example data:
| ID | Status | Created Date | Resolved Date |
|---|---|---|---|
| ABC-1234 | Closed | 2018-07-02 | 2018-07-02 |
| ABC-1235 | Closed | 2018-07-02 | 2018-07-02 |
| ABC-1236 | Closed | 2018-06-29 | 2018-07-02 |
I’ve included ID and Status here, but that is not needed to do the calculations we are going to do
Flow time for the next item
Flow time is what Dan calls it but that could also be called Lead time or Cycle time, but that gets into theoretical Lean arguments. Flow Time is good enough for us.
Flow time is the time between start and stop. +1, since if you started and stopped work on the same day that would count as one day’s worth of work. This is easy to calculate in Google Sheets; =DATEDIF(Created Date, Resolved Date, "d") +1
Let’s create a new tab for “Flow time” and populate it with the following columns:
First I import all relevant rows using the powerful QUERY-function
=QUERY(RawData!A:D, "SELECT A, B, C, D WHERE B = 'Closed'")
This will give you all the columns from the RawData-tab and then we can create an additional column to calculate Flow time in the E-column:
=DATEDIF(C2, D2, "d") +1
Fill the entire column with this formula, calculating the Flow time in days for each row.
Now we want to calculate the Median (50%), 80%-percentile and 95%-percentiles for this data. This will be used as our prognosis data. Add these formulas in the F, G and H columns
| F | G | H |
|---|---|---|
| Median | 80-percentile | 95-percentile |
=PERCENTILE(E:E, 0.5) |
=PERCENTILE(E:E, 0.8) |
=PERCENTILE(E:E, 0.95) |
Now fill all of those columns too, and calculate the percentiles for each row. You could also copy the value from F2, G2, and H2 if you want to improve the performance.
Select all the columns and create a scatter plot using the Flow time, Median, 80, and 95 percentiles. For the percentiles format the series to have Point size set to None and only show a trend line. It should look like this
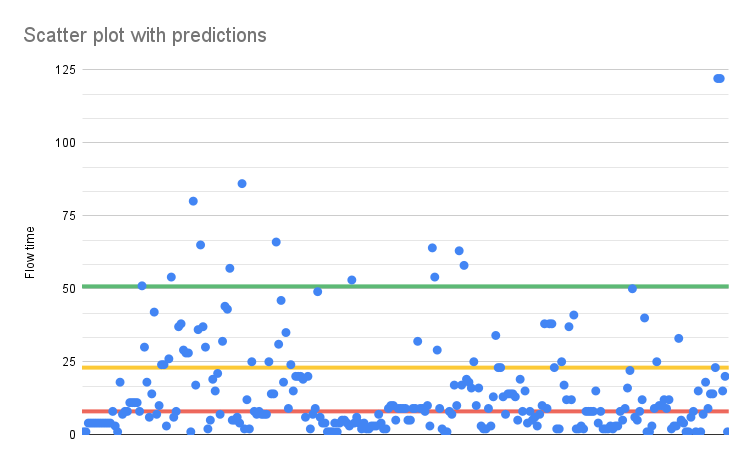
And here we can now see that 50% of all values fall beneath the red, median line, which is at 8 days. And similar for the 80% and 95% line.
We can now say this:
- The next item will take up to 8 days to complete with 50% certainty.
- The next item will take up to 23 days to complete with 80% certainty.
- The next item will take up to 51 days to complete with 95% certainty.
We know this because we have data from 266 items.
That’s a pretty good outcome from just tracking start and stop dates.
When will everything be done?
That was pretty simple to do, but pretty useful. The natural question to follow up with is then “How long will it take to complete all of it?”, or “We have 100 user stories in the upcoming release - when is that done?”.
It’s easy to fall into the trap of just multiplying the flow time with the number of items and say “Since the flow time was 8 days, with 50% certain, and the backlog has 100 items it will take 8 x 100 = 800 days, with 50% certainty”. But that will give the wrong answer, instead, we need to look at the throughput of the system - how many things are completed each day.
Luckily that can also obtained from the same two dates as before. We simply count the number of items that were completed every day.
Open a new tab and call it “Throughput”. In the A-column we’ll get all the dates, in descending order, from the RawData-tab: =SORT(UNIQUE(RawData!D2:D))
In the B-column, we can now count the number of times each date occurs in the raw data, using the following formula: =COUNTIF(RawData!$D$2:$D, A2) and repeat the formula for each row in the B-column.
UPDATED: If you download some data from JIRA you will get timestamps for your Resolved dates and we really need only the date part. Here’s a QUERY that reads the Resolve date (in the X-column of the sheet Jira raw data) and counts the number of occurrences. I.e. the formulas above all at once:
=QUERY(INDEX(DATEVALUE('Jira raw data'!X:X)),"SELECT Col1,COUNT(Col1) group by Col1 ORDER BY Col1 DESC Label Col1 'Date', COUNT(Col1) 'Throughput'")
Parallel realities and Monte Carlo Simulations
This outcome, that particular number of items completed for each day, is one way that it played out. But we want to look into the future and thinking that it will play out the same way doesn’t make sense. I think about it like this: that it would be the same is just one way it can happen - the future holds many potential variants like that.
We want to predict a possible outcome of many uncertainties. This is what Monte Carlo Simulations are for “The Monte Carlo simulation is a mathematical technique that predicts possible outcomes of an uncertain event”
Using our example reality, we will simulate many different possible future outcomes, or timelines and see which ones are more likely. That sounds hard, but the algorithm is pretty simple. Here’s my description of it.
- Define a backlog size you want to know how long it will take to complete. We are going to use 100 items, for simplicity.
- Define a sample to use as a base. We are going to use our existing Throughput data, in the
A:B-columns - Loop
- Select a random day throughput. For example, on 2018-09-14 we completed 2 items
- Subtract that number from the backlog size. 100 - 2 = 98 items left
- When have no items left (or are below zero) we are done. Record the number of iterations that took us. That number is the number of days it took to reach zero for this simulation round
- Add the simulated number of days to a date to see the end date
- Repeat that loop many, many times (10000 is probably needed) and record how many times you reached each date.
- Plot a histogram for the record data.
Making the function to do the Monte Carlo Simulation
As you might no function out-of-the-box accomplishes the Monte Carlo Simulation, for this data. There are ways to do this by copying data into cells etc. But that will be a one-off, where we want to have this repeatable.
Time to crack out the code editor! Let’s create the function MonteCarloSimulateBacklogCompletion. I want to pass 4 parameters:
- The range of our actual throughput data, for example “B2:B”
- The number of simulations we want to run, for example, 10000
- The number of items in the backlog we want to run the simulations on, for example, 100 items
- The start date to run the simulations from, for example, 2024-03-15.
UPDATE
I’ve added an additional parameter for countOnlyWorkdays which is true by default. It will adjust the way we count days, so that we only count working days (not weekends) for a more accurate end-date. I have updated the rest of the blog post with that information.
You can define custom functions in Google Sheets by going to Extensions->App Script and creating a function in the code editor. The code we write here is some variant of JavaScript and I had to write a few helper-functions to perform the Monte Carlo Algorithm, but here is the outline of the code. I’ll show the entire code at the end of the post
function MonteCarloSimulateBacklogCompletion(throughputDataRangeName, numberOfSimulationRuns, backlogSize, startDate, countOnlyWorkdays = true) {
  const throughputValues = rangeToFlatArray(SpreadsheetApp.getActive().getRange(throughputDataRangeName));

  var projectedDates = []
  for(var i=0; i<=numberOfSimulationRuns; i++){
    var days = daysToReachZero(throughputValues, backlogSize);
    if(countOnlyWorkdays) {
      projectedDates.push(addWorkdays(startDate, days))
    }
    else {
      projectedDates.push(addDays(startDate, days))
    }
  }

  const uniqueDays = getUniqueDays(projectedDates).sort()

  const histogramData = uniqueDays.map(ds => {
    return [ds, countMatchingDates(ds, projectedDates)]
  })

  return histogramData;
}

function countMatchingDates(dateStringToCheck, simulatedDays) {
  return simulatedDays.filter(d => dateStringToCheck === d.toISOString().split('T')[0]).length
}

function daysToReachZero(values, backlogSize) {
  var daysCounter = 1;
  var leftOfBacklog = backlogSize;

  while(leftOfBacklog > 0) {
    leftOfBacklog -= randomFromArray(values);
    daysCounter += 1;
  }

  return daysCounter;
}
Some comments on the code:
- First I get our sample data from the range to an array of days, using a helper called
rangeToFlatArray - I repeat the simulations
numberOfSimulationRunsnumber of times- For each simulation, I get the number of days it will take to reach zero (see
daysToReachZerobelow) - I then add that number of days to the
startDateto get the projected end date.- I first check if we should count weekends as working days or not
if(countOnlyWorkdays)addWorkdaysis a custom function that skips counting weekends while adding days.addDayssimply adds the given number days to the date
- I first check if we should count weekends as working days or not
- I store those dates in the
projectedDates
- For each simulation, I get the number of days it will take to reach zero (see
- Each simulation run is performed in the
daysToReachZerofunction- For each iteration I get a new random value from our sample data, using the
randomFromArrayhelper function I’ve written - I then simply count how many iterations it will take me to reach zero or less
- For each iteration I get a new random value from our sample data, using the
At this point, I now have a long list of projected end dates in projectedDates. One for each simulation. We now need to count how many times each date occurs in that list.
The returned data will, in other words, be an array of arrays with two values: the projected date and the number of times that date occurs in projectedDates.
[
  ["2024-05-01", 1],
  ["2024-05-02", 4],
  // etc
]
- I get a list of the unique dates (as formatted strings because I only care about the day-level of a datetime not time) using the
getUniqueDayshelper-function.sort()will sort these dates in descending order
- For each unique date I then create an array with the two values using
uniqueDays.map- I count the number of items each date occurs using the helper function
countMatchingDatesthat compares the date part of the string
- I count the number of items each date occurs using the helper function
- the result of this
.mapis returned to the user, and will be output in two columns.
Again - the detailed code can be found at the end of the blog post.
Using the MonteCarloSimulateBacklogCompletion function
That was very cool! I love me some JavaScript. But let’s put the MonteCarloSimulateBacklogCompletion to good use in our Google Sheet.
I’m going to put the simulation parameters in some cells in the sheet to be able to rerun it as needed:
| Row | D | E |
|---|---|---|
| 1 | Monte Carlo Parameters | |
| 2 | Backlog size | 100 |
| 3 | Start date | 2023-03-14 |
| 4 | Number of iterations | 100000 |
Now I can use my function, remembering that the output will be as many rows as in E4
I added my function in G2 like this: =MonteCarloSimulateBacklogCompletion("B2:B", $E$4, $E$2, $E$3). I used the default value for countOnlyWorkdays, since it defaults to true which is what I wanted.
That will take some time to run (5 seconds ca for 100000 rows) but then we would have two columns with the simulation results.
You can now create a simple Column chart for all the values in G:H and it would look something like this:
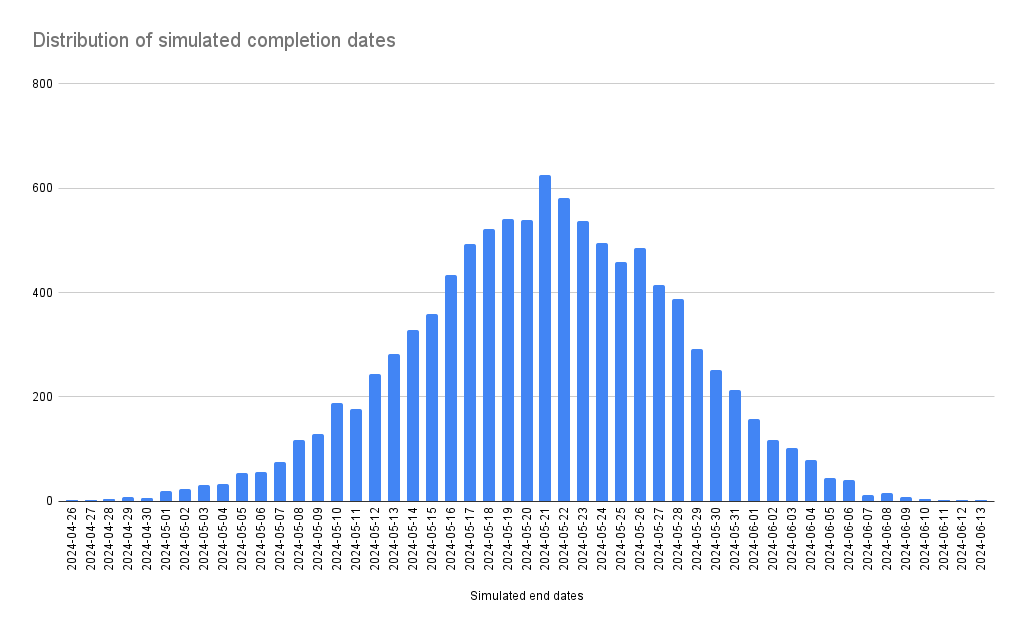
If you update the parameters the simulation will rerun and the graph will be updated. However, during the run, the graph disappears and other values cannot be calculated.
Calculating percentiles
That is cool but the prognosis is a bit hard to see. We wanted to get some certainties and ranges…
For this, we need to calculate the percentiles for this data, which is a little bit tricky. For the 50-percentile we need to find the middle date, for example. We will do that by using INDEX that finds a value from a range based on a row number.
That makes our job pretty easy - we just count the number of values and multiply it with 0.5 (for 50%, for 80% we use 0.8 etc.). Here are my calculations:
| Row | D | E |
|---|---|---|
| 6 | Number of values | =(COUNT(H:H)) |
| 7 | 50 percentile | =INDEX(G:G, $E$6 * 0.5) |
| 8 | 80 percentile | =INDEX(G:G, $E$6 * 0.8) |
| 9 | 95 percentile | =INDEX(G:G, $E$6 * 0.95) |
Now we can answer the initial question like this:
If we started today, 2024-03-14, we would finish 100 items from the backlog:

- With 50% certainty 2024-06-10
- With 80% certainty 2024-07-03
- With 95% certainty 2024-07-16

We used a Monte Carlo Simulation with 100000 iterations and based it on our throughput for the last 178 days.
Summary
I’m very proud that I managed to get this together and working so nicely. The value of this is that you with very little input-collection work (you probably already have this available from JIRA) and can easily produce a prognosis for completion to people around you. This report is based on actual data rather than guesses and estimations.
The full code
Here is the full code listing to implement the MonteCarloSimulateBacklogCompletion as described above. Note the comments that introduce some nice help for the user in Google Sheets.
function rangeToFlatArray(range) {
  var values = range.getValues();
  var flatArray = values.flat(); // Flatten the array of arrays
  return flatArray.filter(value => value !== '');
}

function randomFromArray(arr) {
  return arr[Math.floor(Math.random() * arr.length)];
}

function addWorkdays(startDate, numWorkdays) {
    // Loop through each workday and add to startDate
    let currentDate = new Date(startDate);
    let workdaysAdded = 0;
    while (workdaysAdded < numWorkdays) {
        currentDate.setDate(currentDate.getDate() + 1);

        // Check if the current day is a weekend (Saturday or Sunday)
        if (currentDate.getDay() === 0 || currentDate.getDay() === 6) {
            continue; // Skip weekends
        }

        // If the current day is neither a weekend nor a holiday, increment the workdaysAdded counter
        workdaysAdded++;
    }

    return currentDate;
}


function addDays(date, days) {
  var result = new Date(date);
  result.setDate(result.getDate() + days);
  return result;
}

function getUniqueDays(dateArray) {
  return dateArray.filter((date, i, self) =>
    self.findIndex(d => d.getTime() === date.getTime()) === i
  ).map(d => d.toISOString().split('T')[0])
}

function countMatchingDates(dateStringToCheck, simulatedDays) {
  return simulatedDays.filter(d => dateStringToCheck === d.toISOString().split('T')[0]).length
}


function daysToReachZero(values, backlogSize) {
  var daysCounter = 1;
  var leftOfBacklog = backlogSize;

  while(leftOfBacklog > 0) {
    leftOfBacklog -= randomFromArray(values);
    daysCounter += 1;
  }

  return daysCounter;
}

/**
 * Simulates end dates to complete the backlog using the Monte Carlo Simulation
 *
 * @param {range} throughputDataRangeName A range of actual things completed per day
 * @param {number} numberOfSimulationRuns The number of runs to do. More is better, but also slower. 10000 is probably good enough.
 * @param {number} backlogSize The size of the backlog, and number of items, to use in the simulation
 * @param {date} startDate The date to use as the start date for the calculation
 * @param {boolean} countOnlyWorkdays Indicates if only workdays should be counted, true by default
 * @return unique dates and times each date occurred in the simulation [date, number of occurrences]
 * @customfunction
 */
function MonteCarloSimulateBacklogCompletion(throughputDataRangeName, numberOfSimulationRuns, backlogSize, startDate, countOnlyWorkdays = true) {
  const throughputValues = rangeToFlatArray(SpreadsheetApp.getActive().getRange(throughputDataRangeName));

  var projectedDates = []
  for(var i=0; i<=numberOfSimulationRuns; i++){
    var days = daysToReachZero(throughputValues, backlogSize);
    if(countOnlyWorkdays) {
      projectedDates.push(addWorkdays(startDate, days))
    }
    else {
      projectedDates.push(addDays(startDate, days))
    }
  }

  const uniqueDays = getUniqueDays(projectedDates).sort()

  const histogramData = uniqueDays.map(ds => {
    return [ds, countMatchingDates(ds, projectedDates)]
  })

  return histogramData;
}